
How To Track Mutual Fund Performance in 2026?
India’s mutual fund industry has reached a major milestone, with assets under custody (AUC) rising to ₹70.9 lakh crore in October 2025, but very few track their performance. Many investors invest in mutual funds with the hope that they will steadily increase; however, there’s a catch: not all mutual funds perform in the same way.
Some mutual funds outperform their benchmarks year after year; meanwhile, other funds will silently underperform and diminish your wealth, without you even realising it. That’s why if you can learn how to track mutual fund performance, it is the difference between being an average investor and being a smart investor.
Table of Contents
Why You Should Keep an Eye on Your Mutual Funds?

Knowing how to track mutual fund performance is about protecting your money and maximizing the profits. When you consistently track your funds, you will have the opportunity to confirm they are performing as desired and are still aligned with your financial goals.
Tracking funds has three major benefits outlined below:
- It helps you to identify funds that are underperforming quickly.
- It encourages investor discipline and confidence.
- It limits emotional, fear-based decision-making during market volatility.
Research shows investors who check their portfolios on a quarterly basis experience 27% fewer panic-driven redemptions during market declines; therefore, spending time informing themselves about the data can create better behavior.
How Benchmarks Help You Know If Your Fund Is Doing Well?
Every mutual fund is evaluated against a benchmark index. The benchmark serves as a standard against which the fund measures success. For instance, if the fund’s benchmark is the Nifty 50, and the fund yields 12% returns, while the Nifty provides 10%, then the fund has outperformed the benchmark. However, if the Nifty grew at 15%, and the fund grew at 12%, the fund underperformed even though it yielded positive returns.
Benchmarks provide value because they help to determine if the fund manager is actually adding value.
Understanding the 7/5 3-1 Rule in Mutual Fund
The 7/5 3-1 rule in mutual fund investing is a simple but powerful approach to staying patient and disciplined.
- 7: Stay invested for 7 years or longer. Historical data show that equity mutual funds that have been held for at least the past seven years have been generating average annual returns of 11-13%, even as markets have corrected.
- 5: Diversify among five broad areas: large cap, mid cap, value, GARP (growth at a reasonable price), and international funds. Diversified portfolios experience 40% less volatility than single-category portfolios.
- 3: Understand three emotional phases: irritation (when returns are flat), panic (when returns are negative), and disappointment (when returns are below fixed deposits). Do not act on your emotions during these stages.
- 1: Increase your monthly systematic investment plan (SIP) by at least one unit each year to combat inflation and compound growth.
This rule will help create a structure and keep you focused on the long term instead of the short-term noise.
How to Measure the Performance of Mutual Fund?
If you are curious about how to measure the performance of a mutual fund, here are the key metrics to know the current performance of your mutual fund investments:
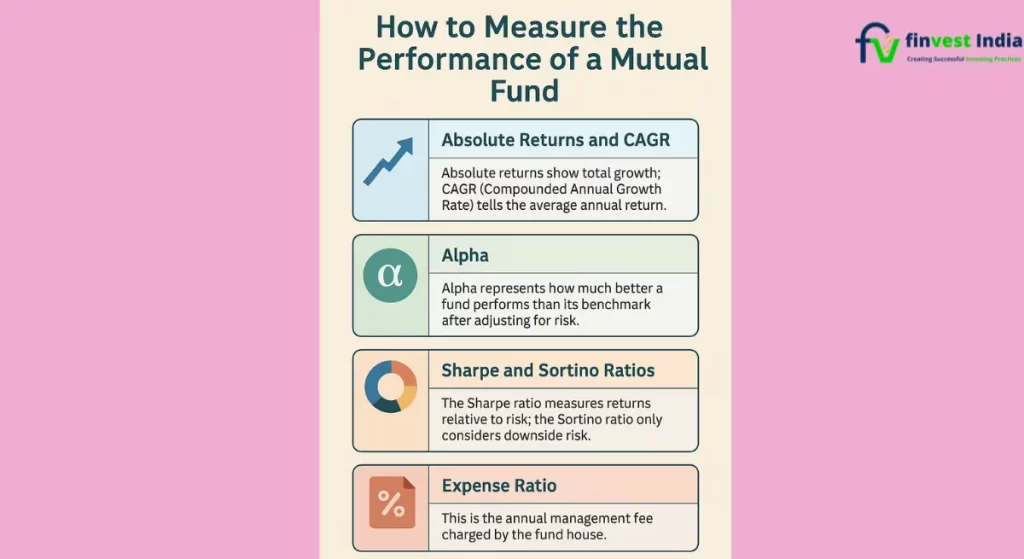
Absolute Returns and CAGR
Absolute returns show total growth. So, if you invested ₹50,000 and it grew to ₹86,000 after three years, you would have an absolute return of 70%. On the other hand, CAGR (Compounded Annual Growth Rate) tells us the average return on a yearly basis, which in this case would be around 11.9% or so, after inflating the absolute return. CAGR is a far better measure of performance when comparing funds over different time horizons.
Alpha
Alpha, which represents how much better your fund performs than its benchmark after adjusting for risk, can be an excellent sign of whether a fund manager is doing a good job. For example, a positive alpha consistently over time (say, of +2% or +3%) would indicate strong management.
Sharpe and Sortino Ratios
The Sharpe ratio tells you how well a fund generates returns for the risk being taken. Ratios greater than 1 are good and those greater than 2 are exceptional. The Sortino ratio only considers downside risk, which provides a clearer view of how well the fund protects your money.
Expense Ratio
This is the annual management fee charged by the fund house. A 1% variance in expense ratio could potentially detract nearly ₹2 lakh from the return on every ₹1 lakh invested over 25 years. Actively managed funds typically charge approximately 0.75% to 1.5%, and index funds may go as low as 0.1%.
These four metrics give you the complete picture of performance, not just returns.
How Digital Tools Help to Track Mutual Fund Performance Easily?
It has never been easier to keep an eye on your mutual funds through technology. But now you can review everything from returns to risk ratios in a matter of moments.
- Mutual Fund Fact Sheets: Released monthly by the appropriate AMC, these mini-comparative reports provide important information, such as the mix of fund portfolios, manager biographies, and returns.
- Real-Time NAV Tracking: The NAV, or Net Asset Value, reflects the price at which the fund is currently trading. Keeping tabs on the NAV can help you conceptualize the shift in your investment based on current market performance.
- Benchmark Comparison Dashboards: These dashboards track and compute on your behalf, alerting you whether or not the fund you own is beating the benchmark.
- Portfolio Trackers: These online tools are new to the investment tracking world. They incorporate all of your holdings, assess their performance, and identify the overlaps you might have in your fund families, and can even estimate what your tax will be or get your money back!
Websites like FinvestIndia can track all of these features in one, consolidated app so you can confidently assess your mutual funds and support your decisions with verifiable data.
Key Takeaways: Why Knowledge Is the Key to Wealth?
Having the skill to track a mutual fund performance approach gives you control over your investments. You are no longer guessing as much; you now understand. It is proven that investors who keep a close handle on their portfolios outperform the portfolios of passive investors by 10 to 20% over the long run.
Finvest India makes this much easier by providing analysis collateralized by professionals in a clear dashboard, meaning you can manage your portfolio like a professional without expert knowledge in finance.
In 2026, market activity will continue to surprise you, but a disciplined tracking approach allows your wealth to remain on course. Start now, develop your tracking system, and utilise tracking tools that help you make smarter decisions. Over time, your active monitoring efforts today will compound into the financial security you envisioned tomorrow